Frank A. Cerreto, Jung Lee, and Wondi Geremew
Abstract
The purpose of this study was to investigate what, if any relationship exists between graph construction ability and interpretation ability. Sixty-seven college students completed two graphing tasks, one involving construction and the other interpretation of graphs, both based on actual data. Statistical analysis of the scores showed no significant correlation between total scores on the two tasks and no significant relationships between specific components of graph construction ability and graph interpretation ability. These results suggest that the two abilities are distinct from one another. The study’s findings add to our understanding of graph construction ability and have practical implications for teaching and learning.
Keywords
graph construction, graph interpretation, graphing data, graphical literacy
Introduction
Graphs are ubiquitous in textbooks, scholarly journals, popular magazines, and newspapers, as well as on the Web (Lewandowsky and Behrens, 1999; Shah, Mayer, & Hegarty, 1999), due to their potential to help viewers understand numerical information (Winn, 1987). Graphs provide a visual medium for identifying patterns and relationships in numerical data and are used extensively when people make decisions (Raschke & Steinbart, 2008).
At the same time, if graphs are wrongly designed or interpreted, they could affect our perception of the actual situation and our resulting judgments. Tufte (1983) presented many examples of graphs that lead to data misinterpretations. Tractinsky and Meyer (1999) argued that misleading graphs may sometimes be created deliberately, and Beattie and Jones (2002a, 2002b) also added that such graphs could reduce decision quality. Especially, these days when creation of graphs is as easy as a couple of clicks, people often produce incomplete, biased, or wrong graphs.
In school, students are often involved in interpreting graphs and constructing graphs. For example, teachers often present results from science lab graphically to ease the complexity and to allow patterns and relationships between scientific variables to be understood (Hardy, Schneider, Jonen, Stern, & Möller, 2005), and students are also expected to make graphs (Shah & Hoeffner, 2002). Thus, graphs are considered a strong communication tools for teachers and students, and graphical interpretation and representation of information are important quantitative literacy skills.
There is a wealth of research on the difficulties viewers have comprehending graphs (Carpenter & Shah, 1998; Cleveland & McGill, 1985; Gattis & Holyoak, 1996; Guthrie, Weber, & Kimmerly, 1993; Leinhardt, Zaslavsky, & Stein, 1990; Maichle, 1994; Shah & Carpenter, 1995; Shah, Mayer, & Hegarty, 1999, Wang, Wei, Ding, Chen, Wang, & Hu, 2012), as well as their implications for the classroom (Friel & Curcio, 2001; Glazer, 2011; Sharma, 2006). However, as Amodeo & Wizner (2012) and Leinhardt and her associates (1990) pointed out, few studies focused on graph construction.
Yet, research studies have found some differences between graph interpretation and construction ability. Leinhardt and her associates (1990) stated, “Construction is quite different from interpretation. Whereas interpretation relies on and requires reaction to a given piece of data, construction requires generating new parts that are not given (p.12)”. Berg and Smith (1994) found widespread lack of graph interpretation and construction abilities of high school science students. Tairab and Al-Naqbi (2004) found that high school students’ interpretation of graphs was much better than their ability to construct graphs. However, there is a lack of study focusing on the relationship between the specific skills and understandings underlying these two abilities.
Cerreto and Lee (2012) focused on college students’ graph construction ability, and showed that graph construction ability is a well-defined construct that is separate from general mathematics and verbal ability. In that study, moderate to strong correlations were found between all pairs of five graphing task components, establishing the validity of the graph creation construct.
Purpose and Research Questions
The purpose of this study is to investigate possible relationships between graph interpretation ability and graph construction ability.
We tried to answer the following two research questions:
- To what extent is general graph construction ability related to graph interpretation ability?
- To what extent are specific components of graph construction ability related to corresponding components of graph interpretation ability?
Participants and Method
The participants in this study are 67 students who were enrolled a four-year, public, comprehensive university in New Jersey. The students were enrolled in one of three classes: a precalculus course, an intermediate algebra course, and a freshman seminar that was not related to mathematics.
The students were given two tasks: graph construction (see Appendix A) and graph (Appendix B) interpretation. Students took the graph construction test first in order to avoid a chance to see any graphs in the interpretation test.
In the construction test, they were given numerical data about the populations and land areas of three countries. Provided with rulers, protractors, calculators and pencils, they were asked to create graphs that could be used to answer three questions about these countries.
The first question asked them to make a comparison, the second, express parts of a whole, and the third, describe a trend. After constructing each of the three graphs, the students were asked to describe their findings. The graphing task was untimed; most students finished within 45 minutes.
After submitting the first test, the second, interpretation, test was given to the student. The graph interpretation test consisted of 12 multiple-choice questions based on given bar graphs, line graphs, and pie charts. It was also untimed; most students finished in 15 minutes.
In order to rate the graph construction, we used rubrics for each of five components: the appropriateness of the created graph to the question (Type), the quality and completeness of the labeling of the graph (Labels), the correctness of the axis scales (Scales), the accuracy of the drawing (Accuracy), as well as the correctness and thoroughness of the written response to the question (Explanation).
For each of the three questions, two raters independently assigned a score. Scores of four, three, two, or one, represent excellent, good, fair, or poor, performance, respectively. Off-topic or blank responses received a score of zero. Sum scores, ranging from zero to eight, were used for all subsequent analysis.
To answer the two research questions, we conducted correlational and chi-square analysis.
Results
Comparison of Total Scores
Table 1 shows the correlation analysis between total scores on the graph construction and graph interpretation tasks. Note that the correlation coefficient is not statistically significant (r = 0.051; p = 0.683), indicating no association between the two scores.
| Table 1: Correlations of Total Scores: Graph Construction and Interpretation | |||
| Overall Construction | Overall Interpretation | ||
| Overall Construction | Pearson Correlation | 1 | .051 |
| Sig. (2-tailed) | .683 | ||
| N | 67 | 67 | |
| Overall Interpretation | Pearson Correlation | .051 | 1 |
| Sig. (2-tailed) | .683 | ||
| N | 67 | 67 | |
Comparisons of Specific Components
In order to examine possible relationships between these two abilities more closely, we identified specific items on the graph interpretation task that should correspond to specific components of graph construction ability as measured on the graph construction task.
For example, items D1, D2, and D3 on the graph interpretation task measured the extent to which students were able to determine the most appropriate type of graph to use. Table 2 shows the results of chi square analysis between scores on the Type component of graph construction and scores on items D1, D2, and D3 in the graph interpretation task. The result shows no significant relationship in the Type component between graph construction and graph interpretation.
| Table 2: Chi-Square Tests: Graph Construction TYPE and Graph Interpretation Items D1, D2, and D3 | |||
| Value | df | Asymp. Sig. (2-sided) | |
| Pearson Chi-Square | 1.026 | 2 | .599 |
| Likelihood Ratio | 1.029 | 2 | .598 |
| N of Valid Cases | 67 | ||
Similarly, items A1, A3, B1, and B2 on the graph interpretation task measured students’ accuracy and labelling ability. As shown in Table 3, chi-square analysis indicates no relationship in the Accuracy and Labels components between graph construction and graph interpretation.
| Table 3: Chi-Square Tests: Graph Construction Accuracy/Labels and Graph Interpretation Items A1, A3, B1, and B2 | |||
| Value | df | Asymp. Sig. (2-sided) | |
| Pearson Chi-Square | .383 | 2 | .826 |
| Likelihood Ratio | .388 | 2 | .824 |
| N of Valid Cases | 67 | ||
Finally, items A2 and A6 are related to student’s ability to explain the meanings of graphs. As shown in Table 4, the chi-square analysis suggests no relationship in the Explanation component between graph construction and graph interpretation.
| Table 4: Chi-Square Tests: Graph Construction Explanation and Graph interpretation Items A2 and A6 | |||
| Value | df | Asymp. Sig. (2-sided) | |
| Pearson Chi-Square | 1.192 | 2 | .551 |
| Likelihood Ratio | 1.163 | 2 | .559 |
| N of Valid Cases | 67 | ||
Conclusions
The purpose of this study was to examine the possible relationship between graph construction and graph interpretation ability. While conventional wisdom would suggest that graph construction and interpretation are two sides of the same coin, this study refutes that claim. The findings suggest that graph construction and interpretation are distinct abilities, whether compared globally or in terms of individual graphing components.
Although these finding may be surprising at first, on further consideration, we can justify them. In this study, students were asked to construct graphs from given numerical data and to draw numerical conclusions from given graphs. In a sense, these are inverse operations. There are many other examples in the study of mathematics where the skills and understandings needed to move in one direction are different from those needed to move in the opposite direction. For example, the procedures and underlying concepts used to factor polynomials are different from those used to multiply them. In the same way, knowing how to read a scale on a given graph is different from being able to decide on a useful and fair scale to be used in a graph one is creating.
This study has important implications for the classroom and invites questions about the optimal order of instruction of interpretation and construction, explicit instruction on graphing components, and ways to help students establish connections between graph construction and interpretation. Li and Goos (2011) posited that graph construction was a part of graph interpretation. Glazer (2011) suggested that, if students are to be taught how to interpret graphs prior to creating them, then we need to understand what we mean by graph interpretation. We would argue that, regardless of the preferred order of instruction, it is equally important to understand what graph construction entails.
In addition, although this study asked students to use “low-tech” graphing tools, we need to consider that the prevalent use of computer can alter teaching methods for constructing graphs and alter interpretation. For example, when they create graphs on computer, students focus more on the appearance of the graph as opposed to its content and meaning (Li & Goos, 2011). At the same time, as Glazer argued (2011), creating graphs with computers does not negate students’ need for graphic comprehension.
References
Amodeo, V. & Wizner, F. (2012), Scientific Graphing A Review of the Literature, Retrieved from http://www.albany.edu/etap/files/Graphs_in_Science_Education.pdf
Beattie, V., & Jones, M. J. (2002a). The impact of graph slope on rate of change judgments in corporate reports. Abacus (June), 177–199.
Beattie, V., & Jones, M. J. (2002b). Measurement distortion of graphs in corporate reports: An experimental study. Accounting, Auditing & Accountability Journal (Special Issue), 546–564.
Carpenter, P. A., & Shah, P. (1998). A model of the perceptual and conceptual processes in graph comprehension. Journal of Experimental Psychology Applied, 4 (2), 75–100.
Cerreto, F. A, & Lee, J. (2012). Student-constructed graphs and academic abilities. In M.D. Avgerinou (Ed.) New Horizons in Visual Literacy: Selected Readings of the 43rd International Visual Literacy Association Conference, 62-72. IVLA.
Cleveland, W.S. & McGill, R (1985). Graphical perceptions and graphical methods for analyzing scientific data. Science, 229, 828-833.
Friel, S. N., Curcio, F. R., & Bright, G. W. (2001). Making Sense of Graphs: Critical Factors Influencing Comprehension and Instructional Implications,‖ Journal for Research in Mathematics Education, 32 (2), 124–158.
Gattis, M., & Holyoak, K. (1996). Mapping conceptual to spatial relations in visual reasoning. Journal of Experimental Psychology: Learning, Memory, and Cognition, 22(1), 231-239.
Glazer, N. (2011). Challenges with graph interpretation: A review of the literature. Studies in Science Education, 47, 183-210
Guthrie, J. T., Weber, S., & Kimmerly, N. (1993). Searching documents: Cognitive process and deficits in understanding graphs, tables, and illustrations. Contemporary Educational Psychology, 18 (2), 186-221.
Leinhardt, G., Zaslavsky, O., & Stein, M. K. (1990). Functions, graphs, and graphing: Tasks, learning, and teaching. Review of Educational Research, 60 (1). 1–64.
Lewandowsky, S., & Behrens, J. T. (1999). Statistical graphs and maps. In F. Durso, S. Dumais, R. Nickerson, R. Schvaneveldt, M. Chi, & S. Lindsay (Eds.), The Handbook of Applied Cognitive Psychology, pp. 513–549. Chichester, England: Wiley.
Li, K., & Goos, M. (2011). Reinforcing students’ correlation comprehension. International Journal of Learning, 17, 261-274.
Maichle, U. (1994). Cognitive processes in understanding line graphs. In W. Schnotz, & R. W. Kulhavy (Eds.), Comprehension of Graphics, 207-226. Amsterdam: Elsevier.
Raschke, R. L. & Steinbart, P. J. (2008). Mitigating the Effects of Misleading Graphs on Decisions by Educating Users about the Principles of Graph Design. Journal of Information Systems, 22 (2), 23-52.
Shah, P., & Carpenter, P. A. (1995). Conceptual limitations in comprehending line graphs. Journal of Experimental Psychology: General, 124 (1), 43-61.
Shah, P., & Hoeffner, J (2002). Review of Graph Comprehension Research: Implications for Instruction. Educational Psychology Review, 14 (1). 47-69.
Shah, P., Mayer, R. E., & Hegarty, M. (1999). Graphs as aids to knowledge construction: Signaling techniques for guiding the process of graph comprehension. Journal of Educatinal Psychology, 91(4), 690–702.
Sharma, S. V. (2006). High school students interpreting tables and graphs: Implications for research. International Journal of Science and Mathematics Education, 4, 241-268.
Tairab, H., & Khalaf Al-Naqbi, A. (2004). How do secondary school science students interpret and construct scientific graphs? Journal of Biological Education, 38 (3), 127-132.
Tractinsky, N., & Meyer, J. (1999). “Junkchart or Goldgraph? Effects of Presentation Objectives and Content Desirability on Information Presentation,” MIS Quarterly, 23, 397-420.
Tufte, E. R. (1983). The Visual Display of Quantitative Information, Graphics, Cheshire, CT.
Wang, Z. H., Wei, S., Ding, W., Chen, X., Wang, X., & Hu, K. (2012). Students’ Cognitive Reasoning of Graphs: Characteristics and progression. International Journal of Science Education, 34(13), 2015-2041.
Winn, W. (1987). Charts, graphs, and diagrams in educational materials. In D. Willows, & H. A. Houghton (Eds.), The Psychology of Illustration, 152-198. New York: Springer.
APPENDIX A: Graph Construction task
Name:_________________________________________ Date:_________________
The following tables contain data on the three major countries of North America (Source: www.census.gov).
Table 1: Areas of North American Countries
| Country | Area (sq. km) |
| Canada | 9,984,670 |
| Mexico | 1,964,375 |
| United States | 9,629,091 |
Table 2: Mid-year Population of Canada
| Year | Population |
| 1950 | 14,011,000 |
| 1960 | 18,267,000 |
| 1970 | 21,750,000 |
| 1980 | 24,593,000 |
| 1990 | 27,791,000 |
| 2000 | 30,689,000 |
| 2010 | 33,760,000 |
Table 3: Mid-year Population of Mexico
| Year | Population |
| 1950 | 24,485,000 |
| 1960 | 38,579,000 |
| 1970 | 52,775,000 |
| 1980 | 68,347,000 |
| 1990 | 84,914,000 |
| 2000 | 99,927,000 |
| 2010 | 112,469,000 |
Table 4: Mid-year Population of the USA
| Year | Population |
| 1950 | 151,868,000 |
| 1960 | 179,979,000 |
| 1970 | 203,984,000 |
| 1980 | 227,225,000 |
| 1990 | 249,623,000 |
| 2000 | 282,172,000 |
| 2010 | 308,282,000 |
On the following pages, you will be asked to draw graphs that can be used to answer questions about these three countries and to use these graphs to answer the questions. You will be provided with a protractor and a ruler. Please draw the graphs as accurately and as clearly as possible.
1. Suppose you wanted to compare the populations of the three countries in the year 2000.
- Based on the graph, write a few sentences comparing the populations of the three countries.
- Draw a useful graph.
2. Suppose you wanted to examine what portion of the total area of North America is occupied by each of the three countries.
- Draw a useful graph in this space.
- Based on the graph, write a few sentences about the portions of the total area occupied by each country.
3. Suppose you wanted to determine which of the three countries had the fastest rate of population growth from 1950 to 2010.
- Draw a useful graph in this space.
- Based on the graph, write a few sentences comparing the population growth rates of these three countries during this period.
Appendix B: Graph Interpretation Task
Name________________________________________ Date____________________
Part A. This graph contains information about the recent populations of three fictitious towns: Allentown, Brownsville, and Crowell.
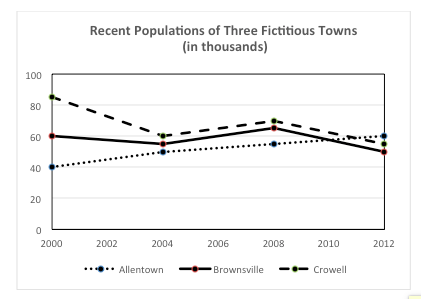
1. What was the approximate population of Brownsville in the year 2008?
- 60
- 65
- 60,000
- 65,000
- It cannot be determined from this graph.
2. Which town showed the steadiest change in population from 2000 to 2012?
- Allentown
- Brownsville
- Crowell
- It cannot be determined from this graph.
3. Approximately, by how many people did the population of Allentown grow from 2004 to 2012?
- 10
- 15
- 10,000
- 15,000
- It cannot be determined from this graph.
4. Which town had the largest population in more than one year?
- Allentown
- Brownsville
- Crowell
- It cannot be determined from this graph.
5. Which town has the largest area?
- Allentown
- Brownsville
- Crowell
- It cannot be determined from this graph.
6. During 2000 -2004, which town population decreased the fastest?
- Allentown
- Brownsville
- Crowell
- It cannot be determined from this graph.
Part B. This graph contains information about the land areas of three fictitious towns: Allentown, Brownsville, and Crowell.
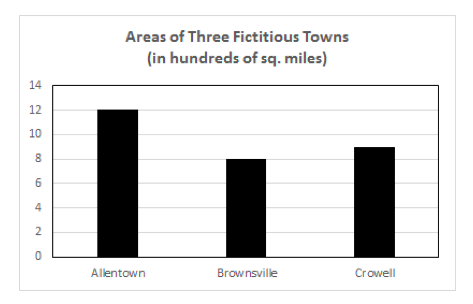
- In square miles, what is the approximate land area of Crowell?
- 8.5
- 9
- 850
- 900
- It cannot be determined from this graph.
- In square miles, approximately how much larger is Allentown than Brownsville?
- 4
- 5
- 400
- 500
- It cannot be determined from this graph.
Part C. Consolidation
1. Using both graphs in Part A and Part B, which town had the highest population densely (number of people per square mile) in the year 2000?
- Allentown
- Brownsville
- Crowell
- It cannot be determined from the two graphs.
Part D. These graphs present information about the age groups of the Allentown population in 2012.

1. Which graph is the most difficult to use if you want to determine values accurately?
- The pie chart
- The bar graph
- The line graph
- The 3-D bar graph
- It cannot be determined.
2. Which graph would be the least appropriate if you wanted to compare the number of people in two different age groups?
- The pie chart
- The bar graph
- The line graph
- The 3-D bar graph
- It cannot be determined.
3, Which graph would be the most appropriate if you wanted to determine which age group represented the closest to one-eighth of the total population?
- The pie chart
- The bar graph
- The line graph
- The 3-D bar graph
- It cannot be determined.
IVLA Selected Readings, 2014-15, first published on visualliteracytoday.org.